Install from CRAN using:
install.packages("PrettyCols")Or install the development version using:
remotes::install_github("nrennie/PrettyCols")Then load into R:
Set up a simple data frame to use for an example plot:
library(ggplot2)
df <- data.frame(type = c("A", "B", "C"),
                 value = c(1, 2, 3))
To change the fill or colour for discrete variables:
ggplot(data = df,
mapping = aes(x = type, y = value, fill = type)) +
geom_col() +
scale_fill_pretty_d(name = "Blues")
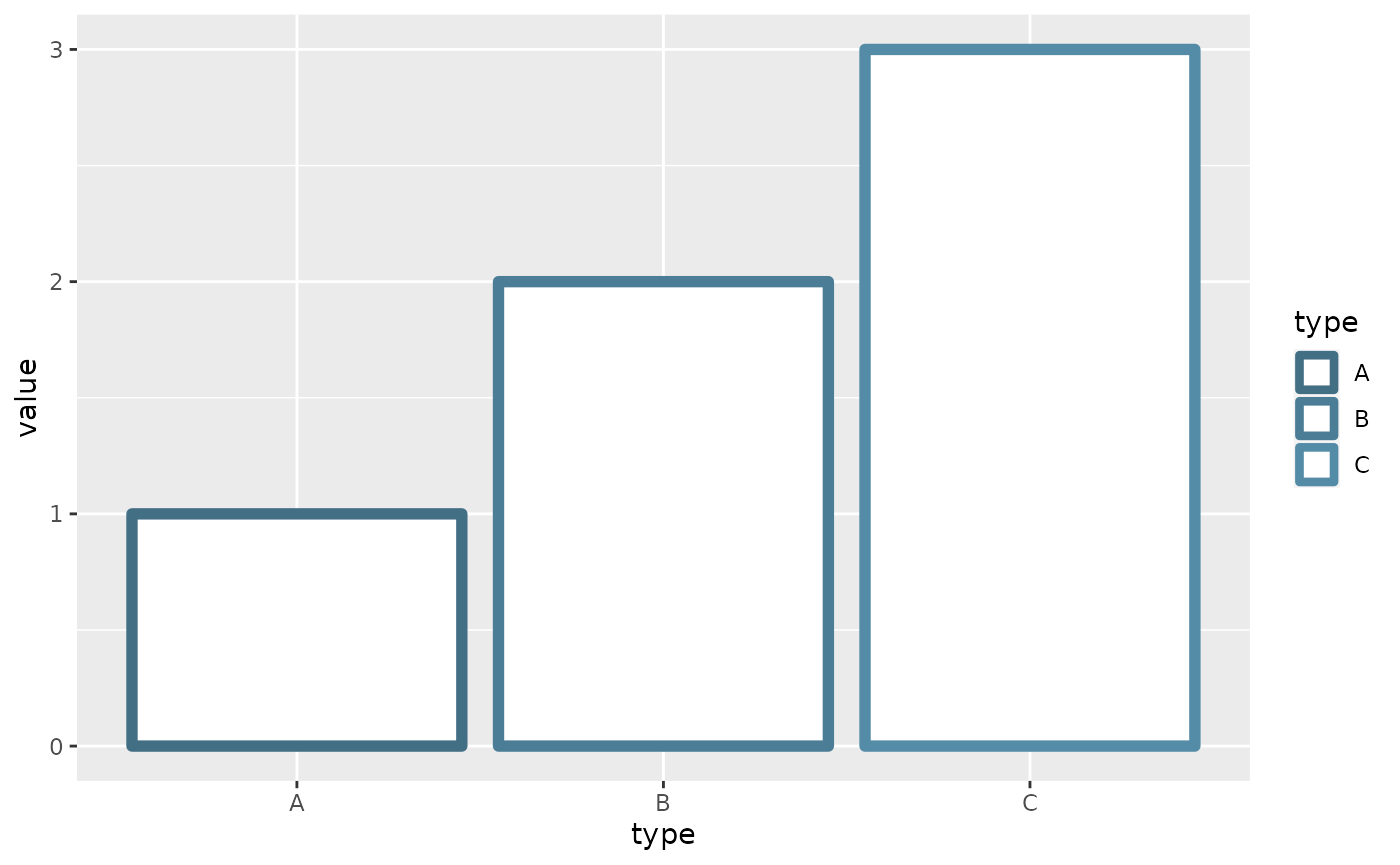
ggplot(data = df,
mapping = aes(x = type, y = value, colour = type)) +
geom_col(linewidth = 2, fill = "white") +
scale_colour_pretty_d(name = "Blues")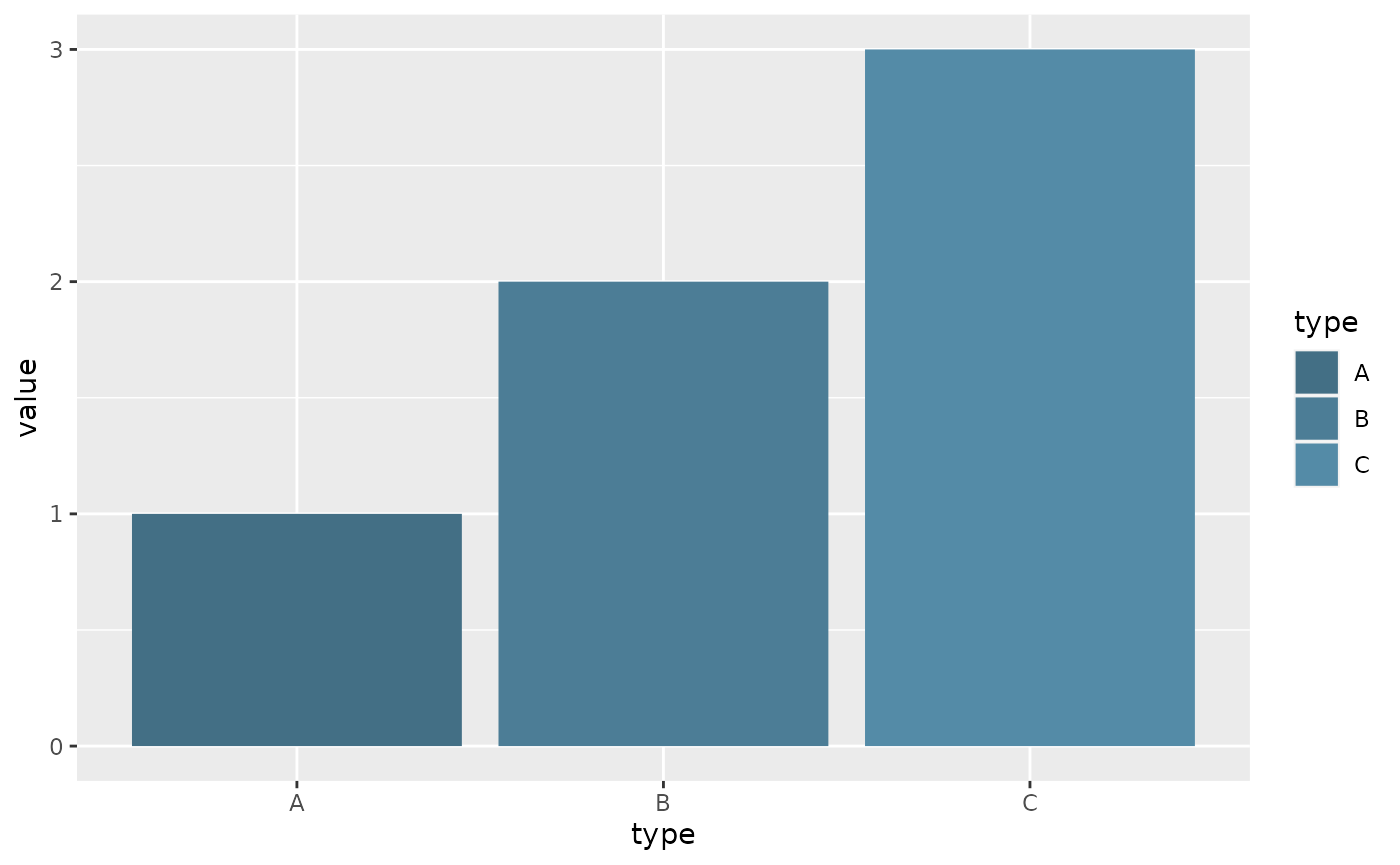
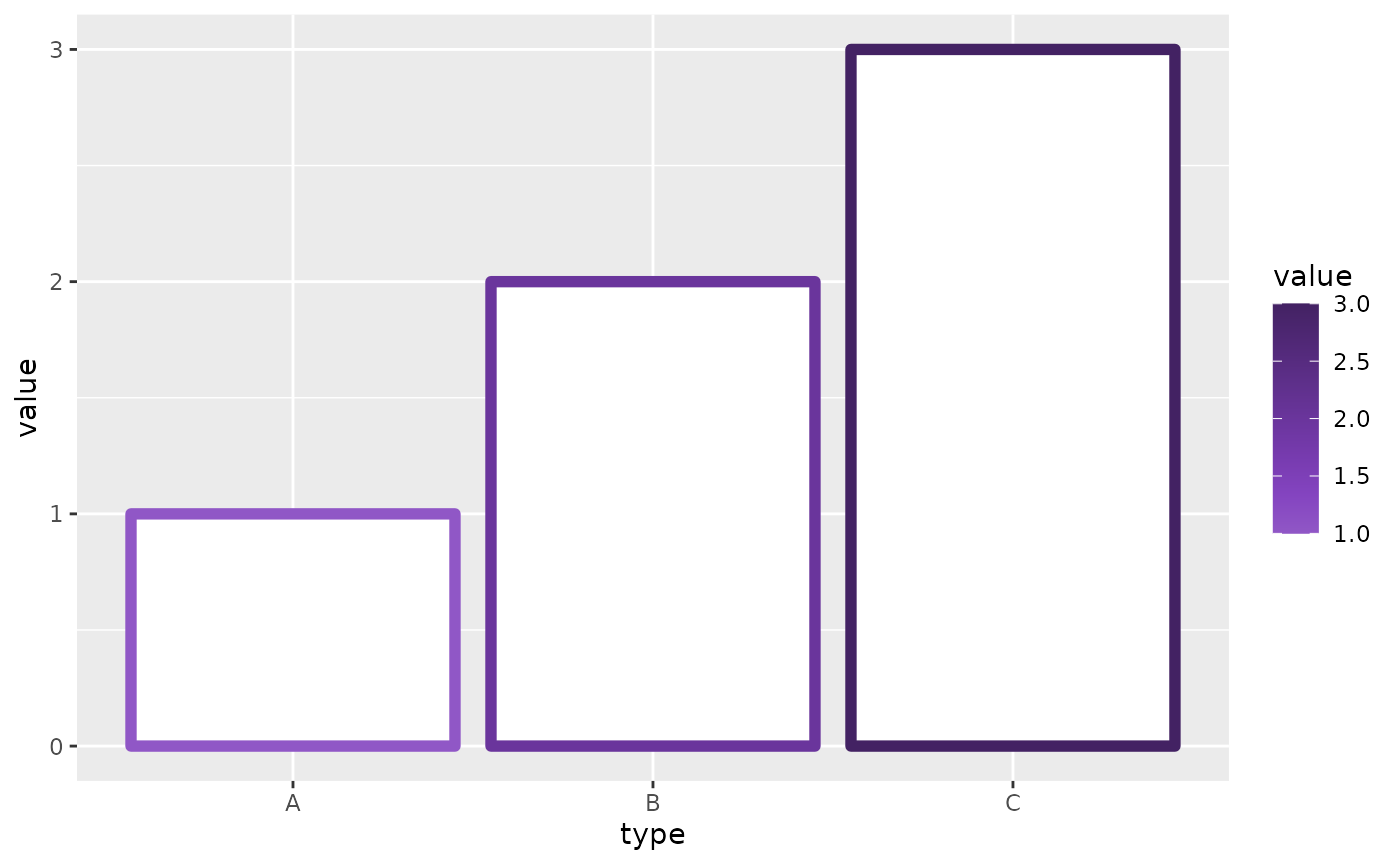
To change the fill or colour for continuous variables:
ggplot(data = df,
       mapping = aes(x = type, y = value, fill = value)) +
  geom_col() +
  scale_fill_pretty_c(name = "Purples")

ggplot(data = df,
       mapping = aes(x = type, y = value, colour = value)) +
  geom_col(linewidth = 2, fill = "white") +
  scale_colour_pretty_c(name = "Purples", direction = -1)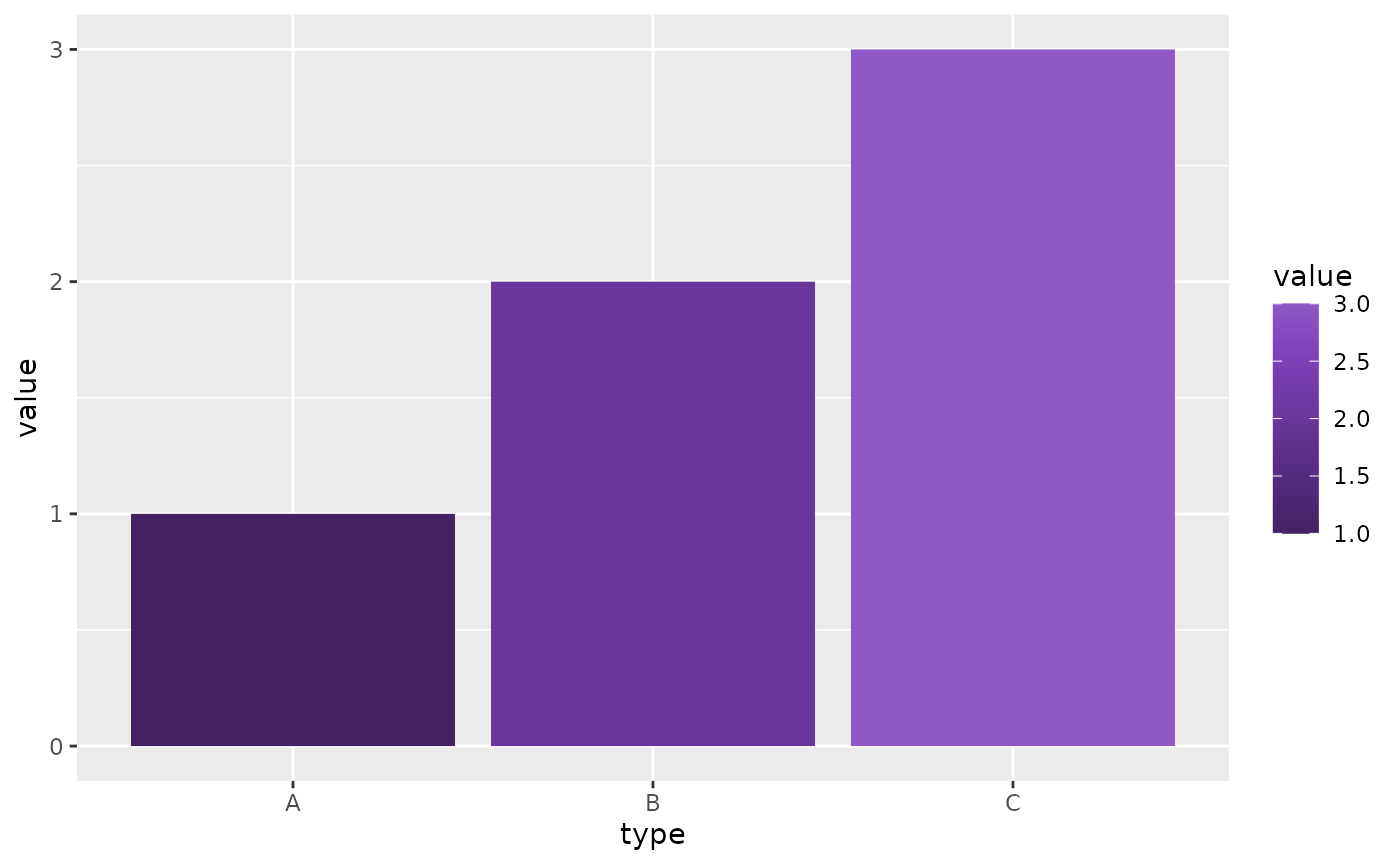
To change the fill or colour for continuous (diverging) variables (using diverging palettes only):
ggplot(data = df,
mapping = aes(x = type, y = value, fill = value)) +
geom_col() +
scale_fill_pretty_div(name = "PurpleYellows", midpoint = 2)
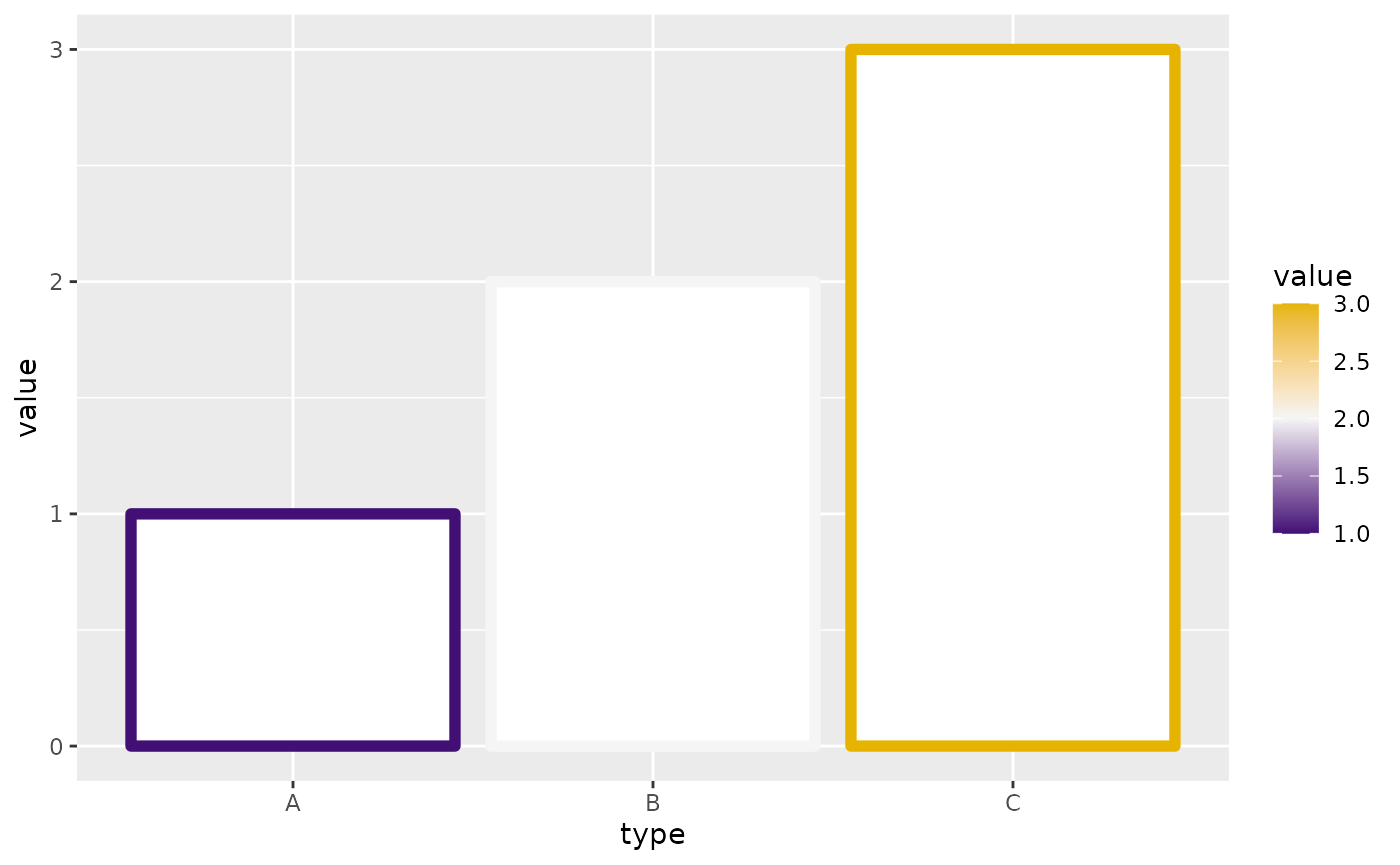
ggplot(data = df,
mapping = aes(x = type, y = value, colour = value)) +
geom_col(linewidth = 2, fill = "white") +
scale_colour_pretty_div(name = "PurpleYellows", midpoint = 2)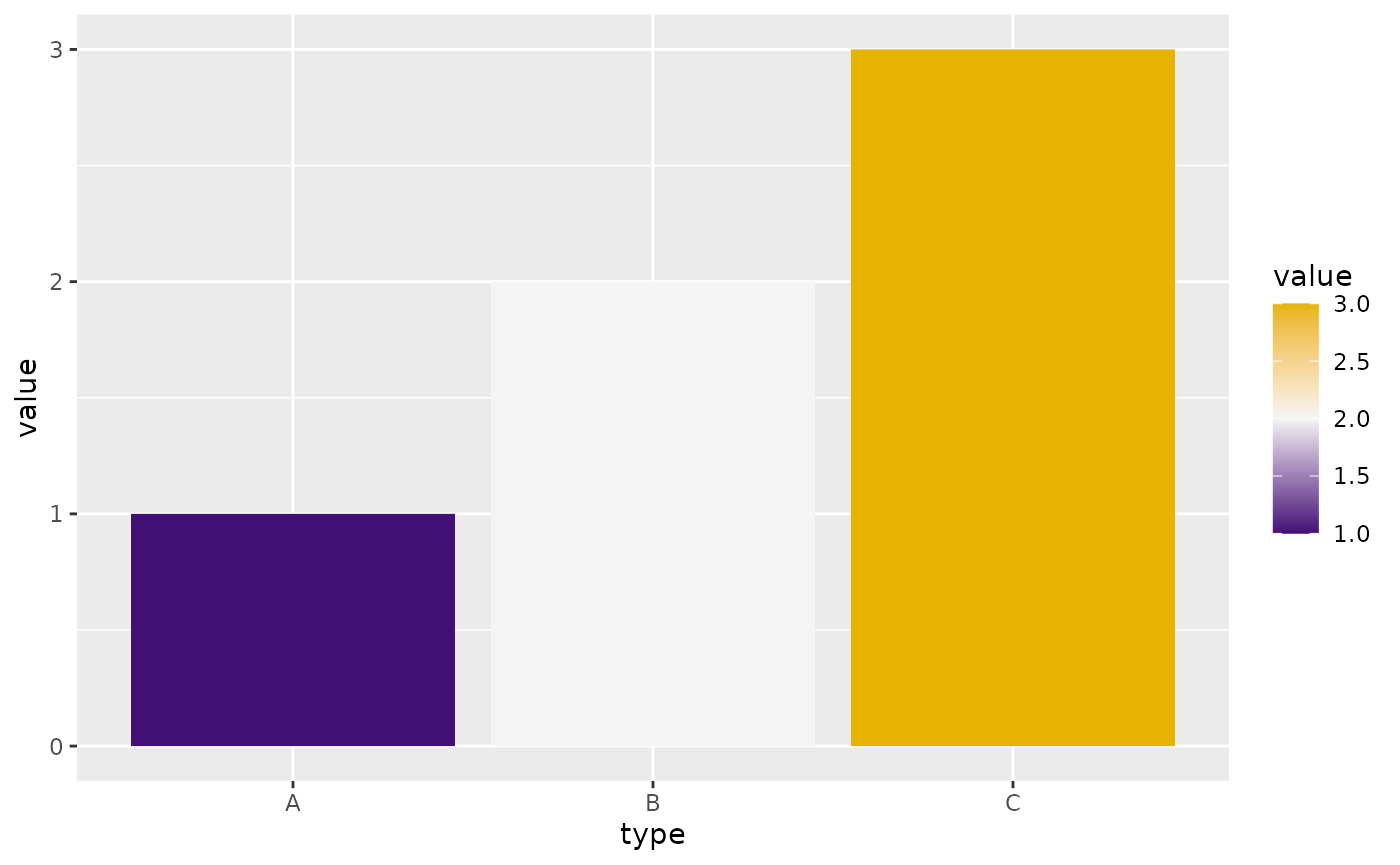
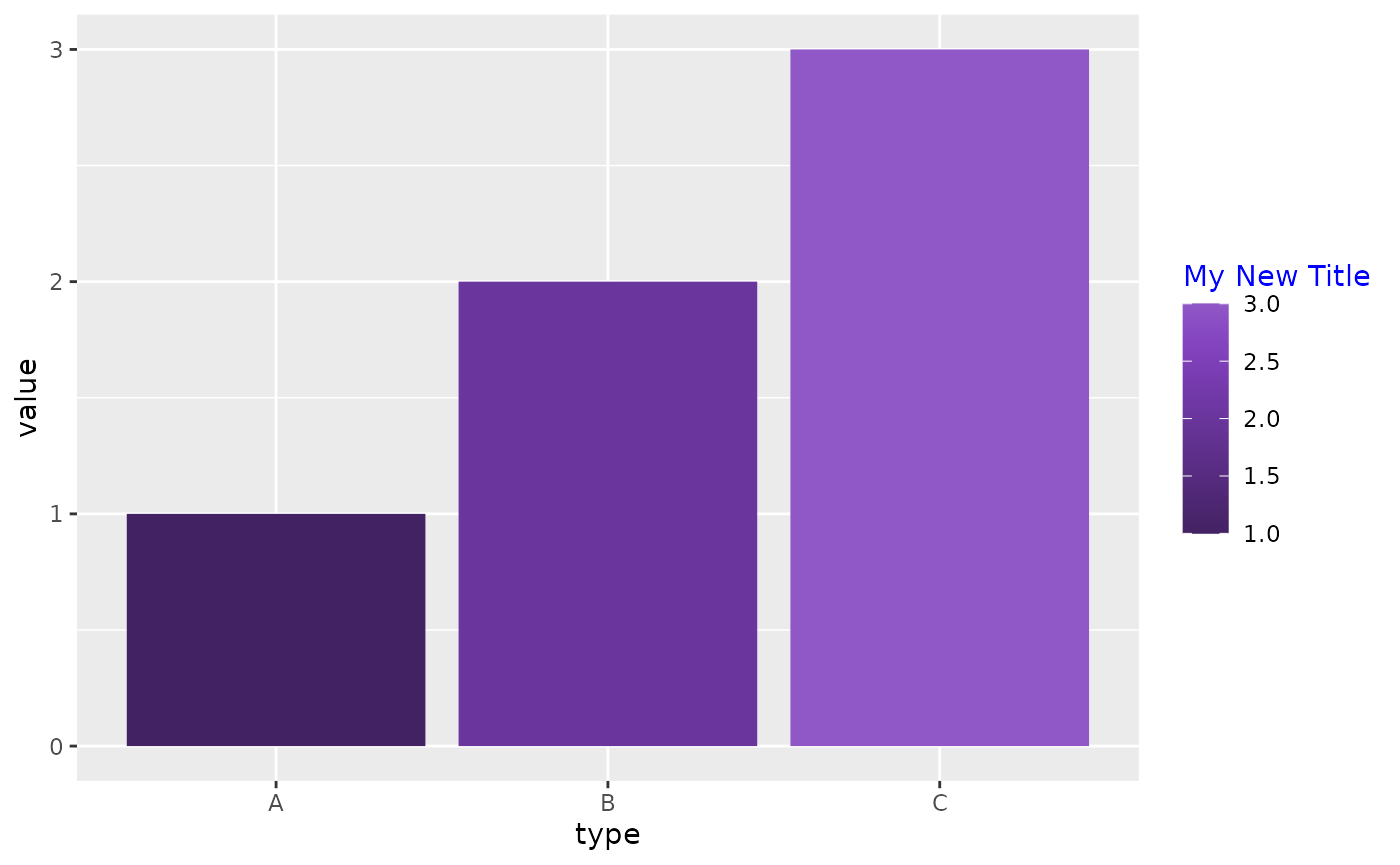
To change the legend title:
ggplot(data = df,
       mapping = aes(x = type, y = value, fill = value)) +
  geom_col() +
  scale_fill_pretty_c(name = "Purples", legend_title = "My New Title") +
  theme(legend.title = element_text(colour = "blue"))