Create a tibble (or data frame) with each row representing an edge.
data <- tibble::tibble(
  from = c("A", "A", "A", "B", "C", "F"),
  to = c("B", "C", "D", "E", "F", "G")
)
Create the flowchart using the ggflowchart()
function.
ggflowchart(data)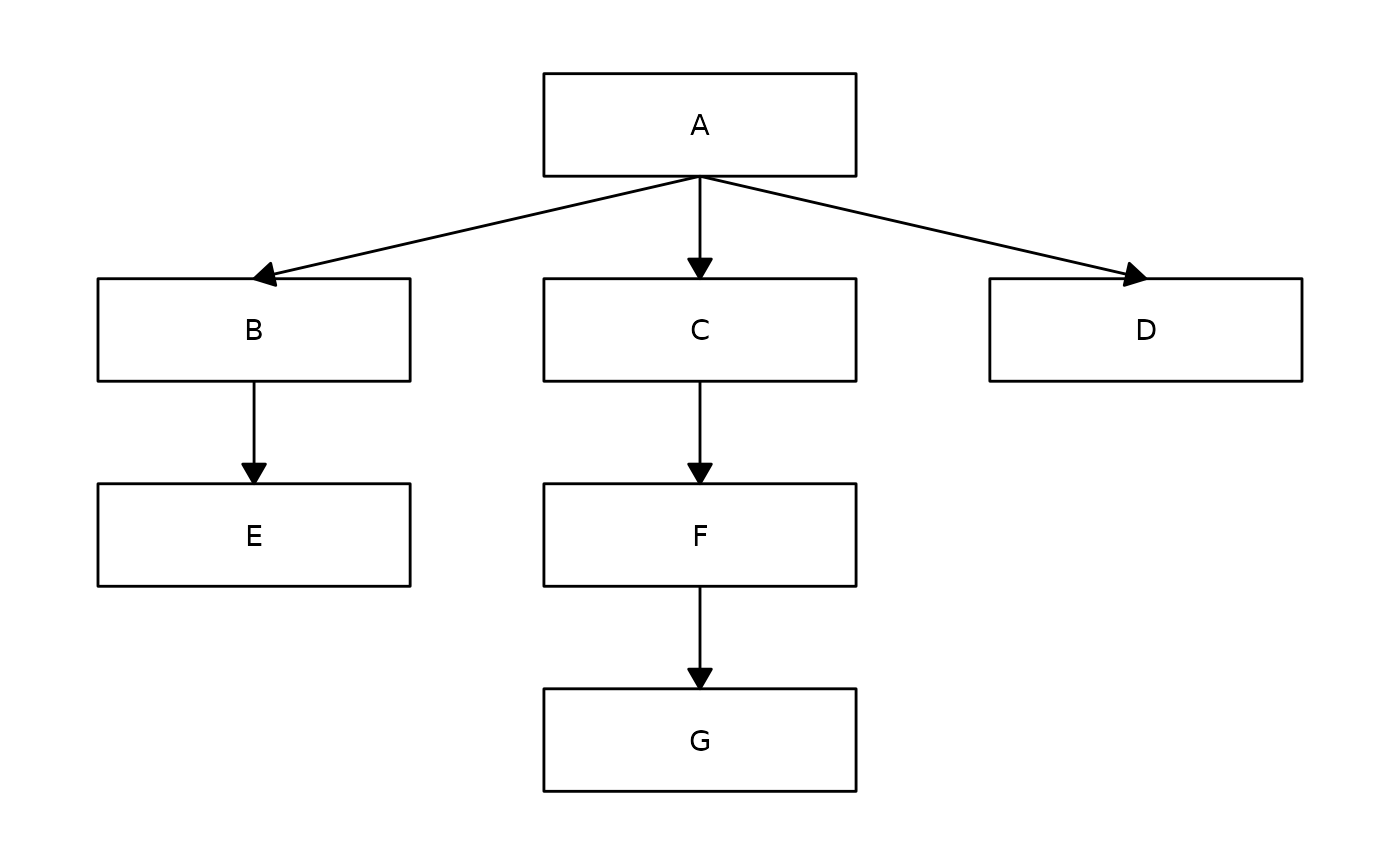
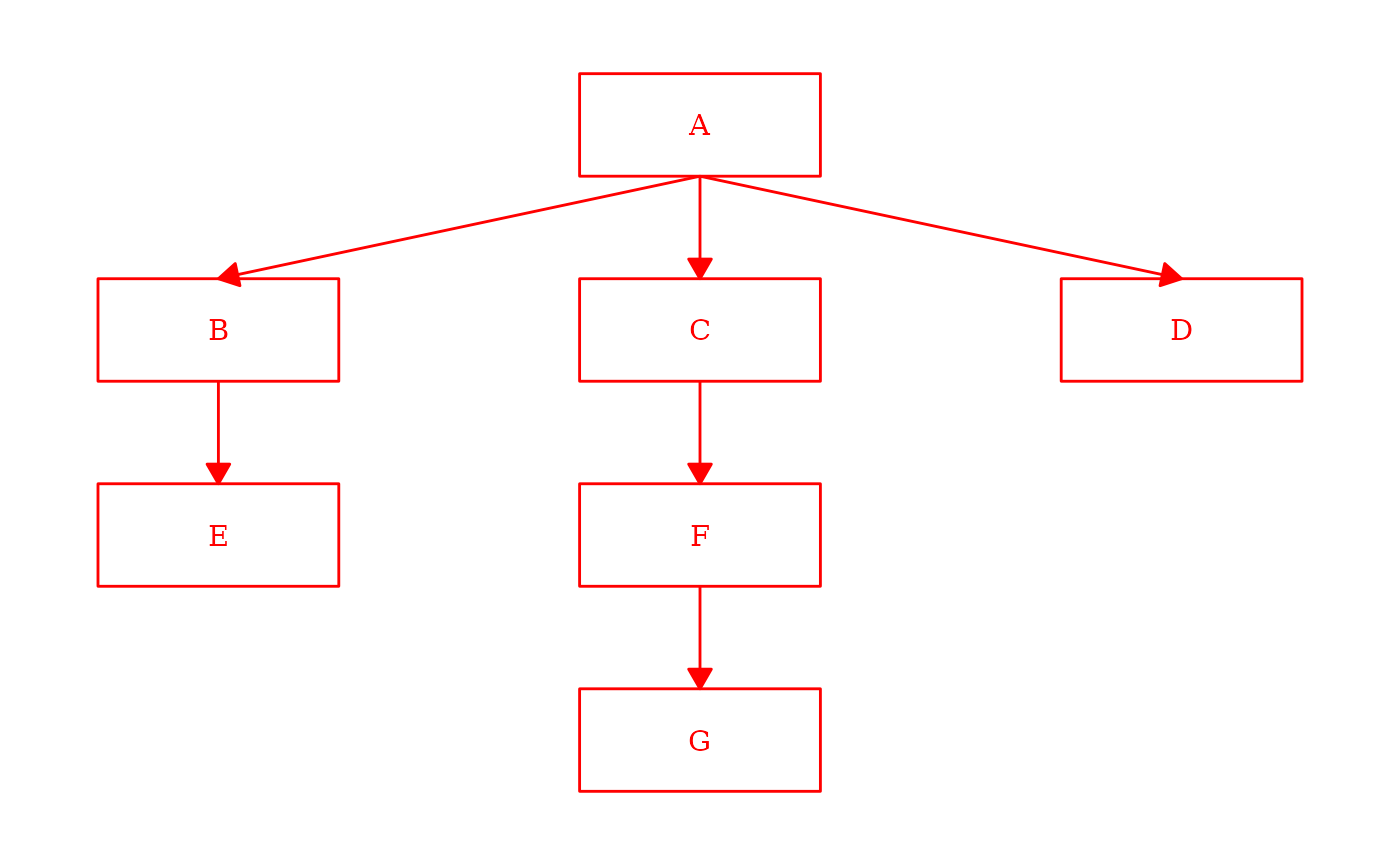
Change the default styling.
ggflowchart(data,
  colour = "red",
  text_colour = "red",
  arrow_colour = "red",
  family = "serif",
  x_nudge = 0.25
)
Add labels to the arrows.
data <- tibble::tibble(
  from = c("A", "A", "A", "B", "C", "F"),
  to = c("B", "C", "D", "E", "F", "G"),
  label = c("Yes", "No", NA, "Yes", NA, NA)
)
ggflowchart(data)
#> Warning: Removed 3 rows containing missing values (`geom_label()`).![]()