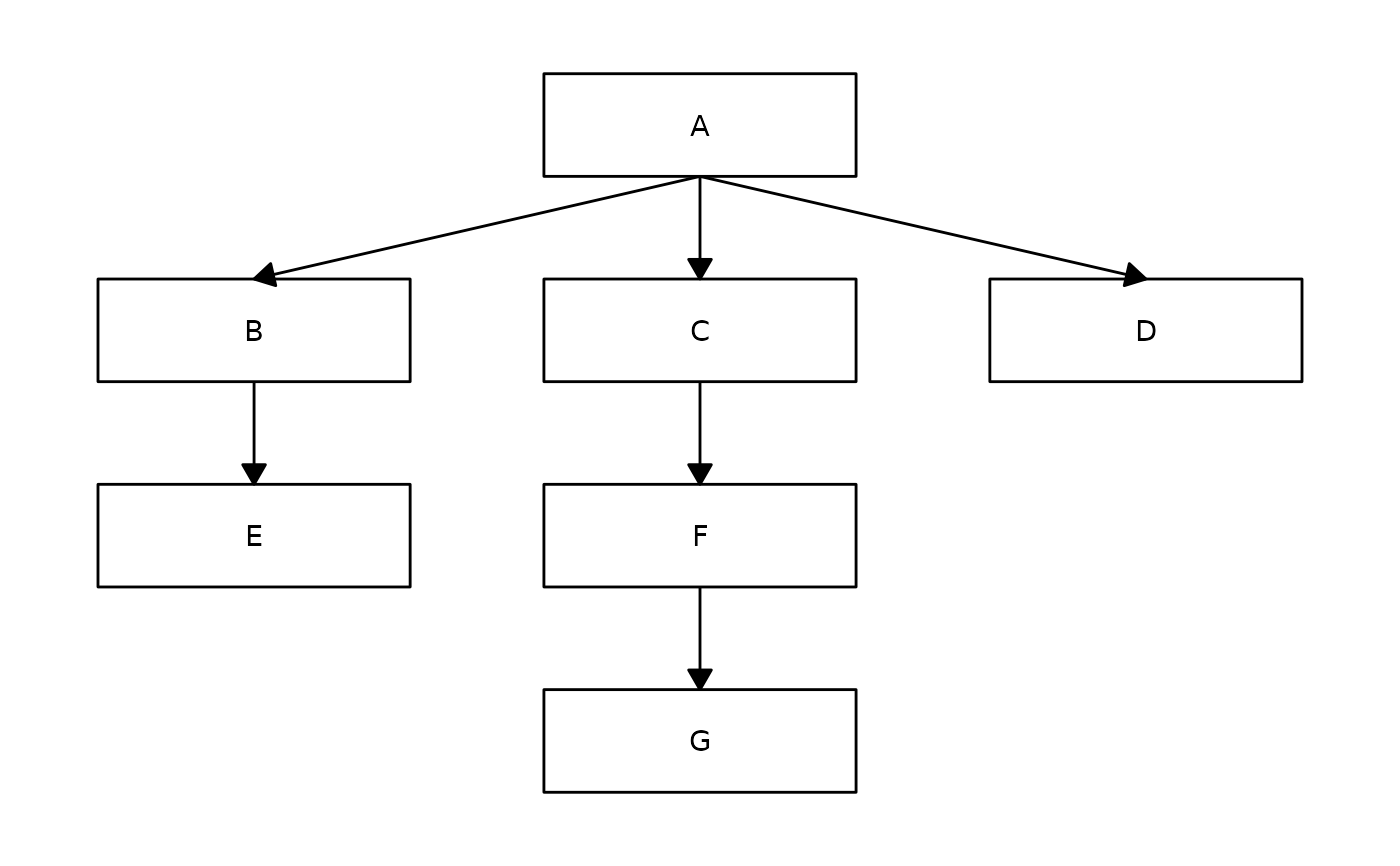
Generates the flowchart
Usage
ggflowchart(
  data,
  node_data = NULL,
  layout = "tree",
  fill = "white",
  colour = "black",
  linewidth = 0.5,
  alpha = 1,
  text_colour = "black",
  text_size = 3.88,
  family = "sans",
  parse = FALSE,
  arrow_colour = "black",
  arrow_size = 0.3,
  arrow_linewidth = 0.5,
  arrow_linetype = "solid",
  arrow_label_fill = "white",
  x_nudge = 0.35,
  y_nudge = 0.25,
  horizontal = FALSE,
  color = NULL,
  text_color = NULL,
  arrow_color = NULL
)
Arguments
- data
Data frame or tibble of edges. Must have two columns, first column are
"from"node names, second column is"to"node names. Node names must be unique.- node_data
Data frame or tibble of node information. If not
NULL, must have at least one column called "name" for node names to join by. DefaultNULL.- layout
One of
c("tree", "custom"). If"tree"uses the tree layout from igraph. If"custom", thenxandycolumns must be provided innode_dataspecifying the coordinates of the centre of the boxes. Default"tree".- fill
Fill colour of nodes. Must be a valid colour name or hex code, or the name of a column in node_data (quoted or unquoted). Column names take priority over names of colours. Default
"white".- colour
Outline colour of nodes. Must be a valid colour name or hex code. Default
"black".- linewidth
Width of node outlines. Default 0.5.
- alpha
Transparency of fill colour in nodes. Default 1.
- text_colour
Colour of labels in nodes. Must be a valid colour name or hex code, or the name of a column in node_data (quoted or unquoted). Column names take priority over names of colours. Default
"black".- text_size
Font size of labels in nodes. Default 3.88.
- family
Font family for node labels. Default
"sans".- parse
If TRUE, the labels will be parsed into expressions and displayed as described in ?plotmath. Default
FALSE.- arrow_colour
Colour of arrows. Must be a valid colour name or hex code. Default
"black".- arrow_size
Size of arrow head. Default 0.3.
- arrow_linewidth
Linewidth of arrow lines. Default 0.5.
- arrow_linetype
Linetype of arrow lines. Default
"solid".- arrow_label_fill
Fill colour of arrow labels. Default
"white".- x_nudge
Distance from centre of edge of node box in x direction. Ignored if
x_nudgeis a column innode_data. Default 0.35.- y_nudge
Distance from centre of edge of node box in y direction. Ignored if
y_nudgeis a column innode_data. Default 0.25.- horizontal
Boolean specifying if flowchart should go from left to right. Default
FALSE.- color
Outline colour of nodes - overrides colour. Must be a valid colour name or hex code. Default
NULL.- text_color
Colour of labels in nodes - overrides text_colour. Must be a valid colour name or hex code. Default
NULL.- arrow_color
Colour of arrows - overrides arrow_colour. Must be a valid colour name or hex code. Default
NULL.