Define input data
The main input data is a two column data frame or tibble of edges. It must have two columns, with the first column containing node names for the “from” nodes, and the second containing node names for the “to” nodes. Node names must be unique.
goldilocks <- tibble::tibble(
  from = c(
    "Goldilocks",
    "Porridge", "Porridge", "Porridge",
    "Just right",
    "Chairs", "Chairs", "Chairs",
    "Just right2",
    "Beds", "Beds", "Beds",
    "Just right3"
  ),
  to = c(
    "Porridge",
    "Too cold", "Too hot", "Just right",
    "Chairs",
    "Still too big", "Too big", "Just right2",
    "Beds",
    "Too soft", "Too hard", "Just right3",
    "Bears!"
  )
)
Optionally, also define additional node attributes.
node_data <- tibble::tibble(name = c(
  "Goldilocks", "Porridge", "Just right", "Chairs",
  "Just right2", "Beds", "Just right3", "Too cold",
  "Too hot", "Still too big", "Too big", "Too soft",
  "Too hard", "Bears!"
)) %>%
  dplyr::mutate(label = gsub("\\d+$", "", name))
Create the flowchart using the ggflowchart()
function.
ggflowchart(goldilocks, node_data)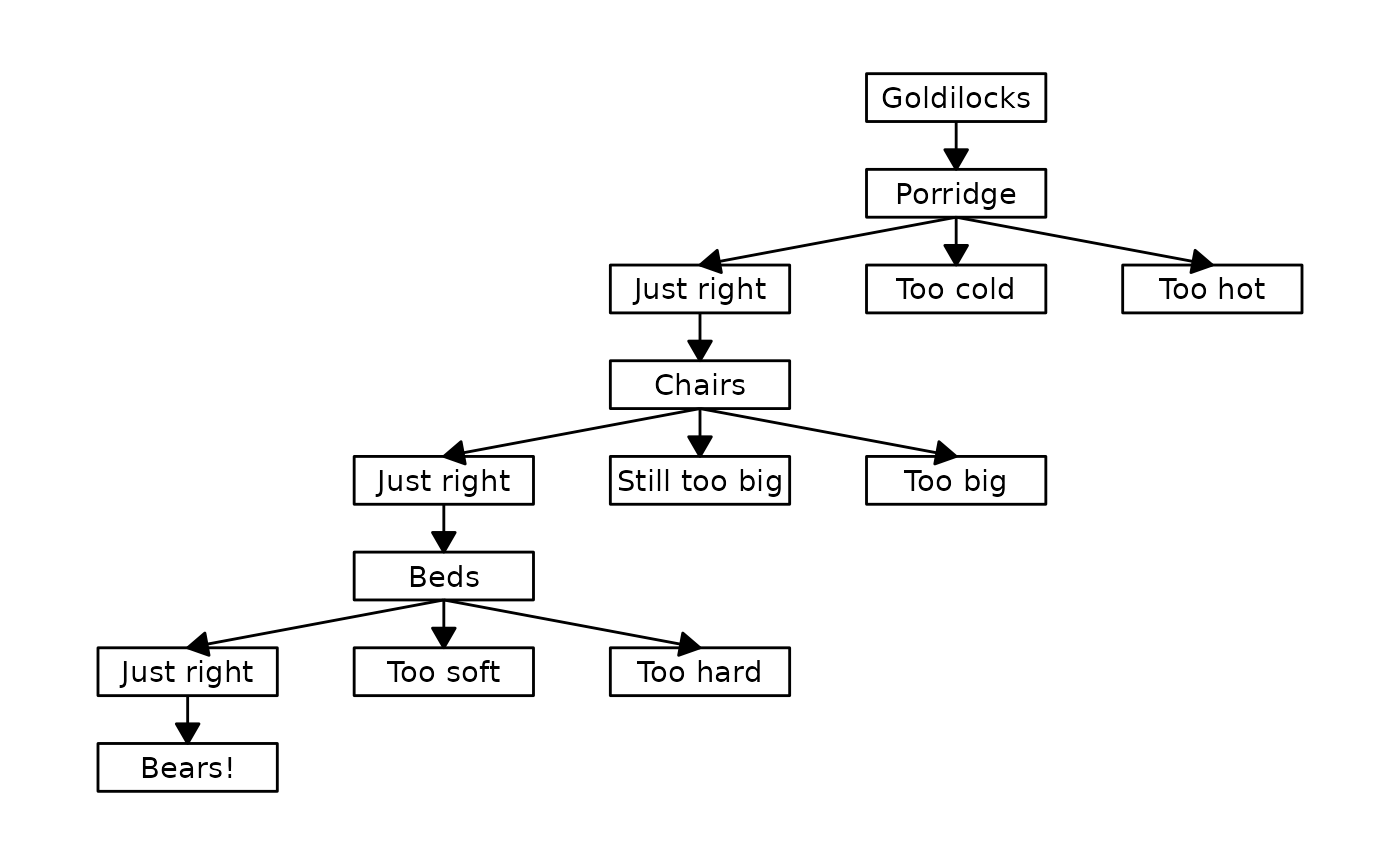
We can also specify a column in node_data we want to
colour the nodes based on:
node_data <- node_data %>%
  dplyr::mutate(
    type = c(
      "Character", "Question", "Answer",
      "Question", "Answer", "Question",
      "Answer", "Answer", "Answer",
      "Answer", "Answer", "Answer",
      "Answer", "Character"
    )
  )
and pass this to the fill argument:
ggflowchart(goldilocks, node_data, fill = type)
Note that the column name can be passed either quoted or unquoted
e.g., ggflowchart(goldilocks, node_data, fill = "type")
will also work. If single colour is passed instead (in quotes e.g.,
"blue") and this is also the name of a column, it will
assume you want to use the values in the column. If that isn’t the case,
please rename the column.
Optionally, add some styling using the {ggplot2} theme()
function and title using the labs() function.
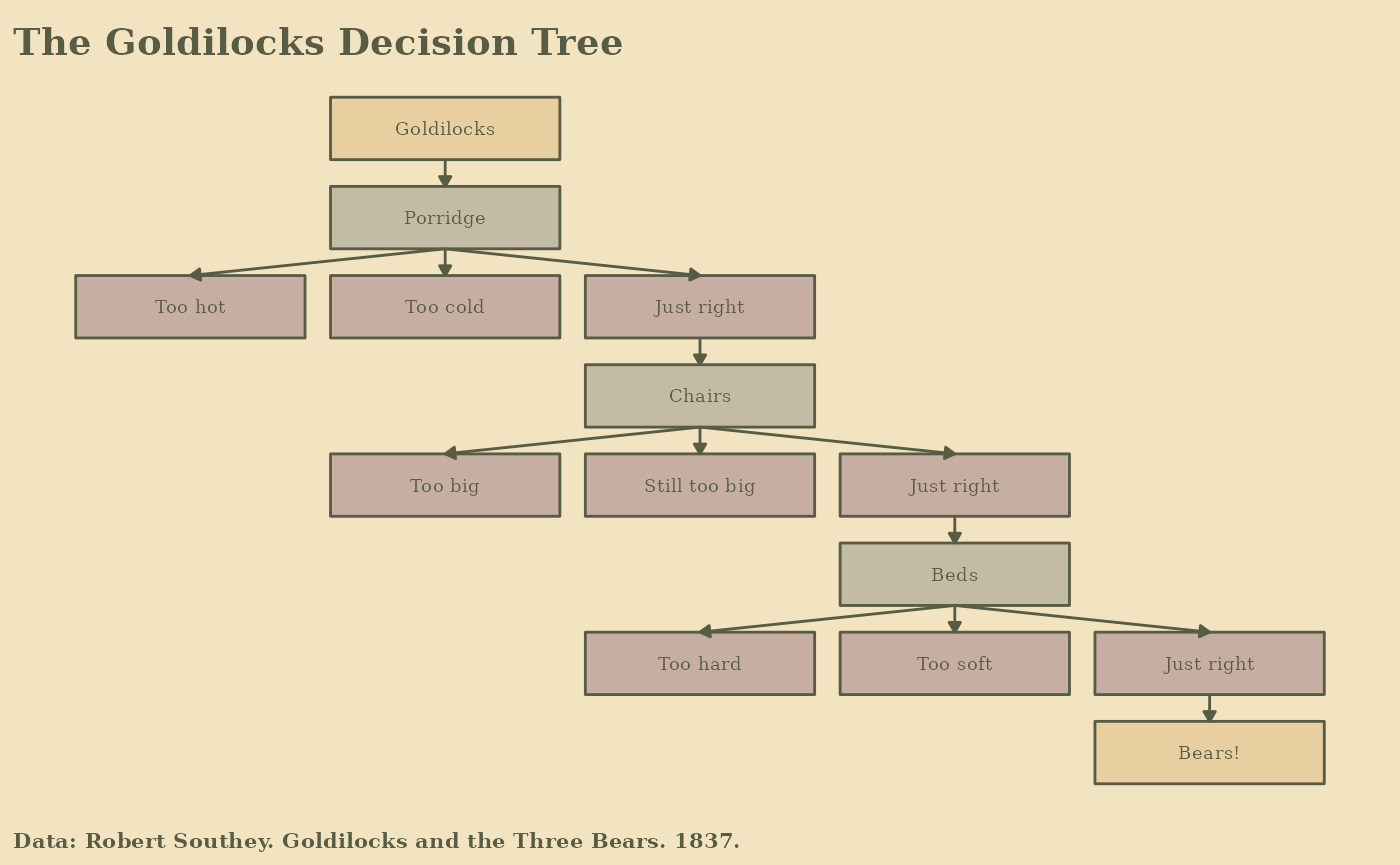
# add additional packages
library(ggplot2)
library(rcartocolor)

# make flowchart
fchart <- ggflowchart(goldilocks,
  node_data,
  fill = type,
  family = "serif",
  colour = "#585c45",
  text_colour = "#585c45",
  arrow_colour = "#585c45",
  arrow_size = 0.15,
  text_size = 2.5,
  alpha = 0.4,
  x_nudge = 0.45,
  y_nudge = 0.35
)

# customise theme
fchart +
  scale_x_reverse() +
  scale_fill_carto_d(palette = "Antique") +
  labs(
    title = "The Goldilocks Decision Tree",
    caption = "Data: Robert Southey. Goldilocks and the Three Bears. 1837."
  ) +
  theme(
    legend.position = "none",
    plot.background = element_rect(
      colour = "#f2e4c1",
      fill = "#f2e4c1"
    ),
    plot.title = element_text(
      size = 14,
      hjust = 0,
      face = "bold",
      family = "serif",
      colour = "#585c45"
    ),
    plot.caption = element_text(
      size = 8,
      hjust = 0,
      lineheight = 0.5,
      face = "bold",
      family = "serif",
      colour = "#585c45"
    ),
    plot.margin = margin(5, 5, 5, 5)
  )