Create a tibble (or data frame) with each row representing an edge.
data <- tibble::tribble(
  ~from, ~to,
  "A", "B",
  "B", "C"
)
The default layout option, "tree" uses the tree layout
from {igraph}.
ggflowchart(data, layout = "tree")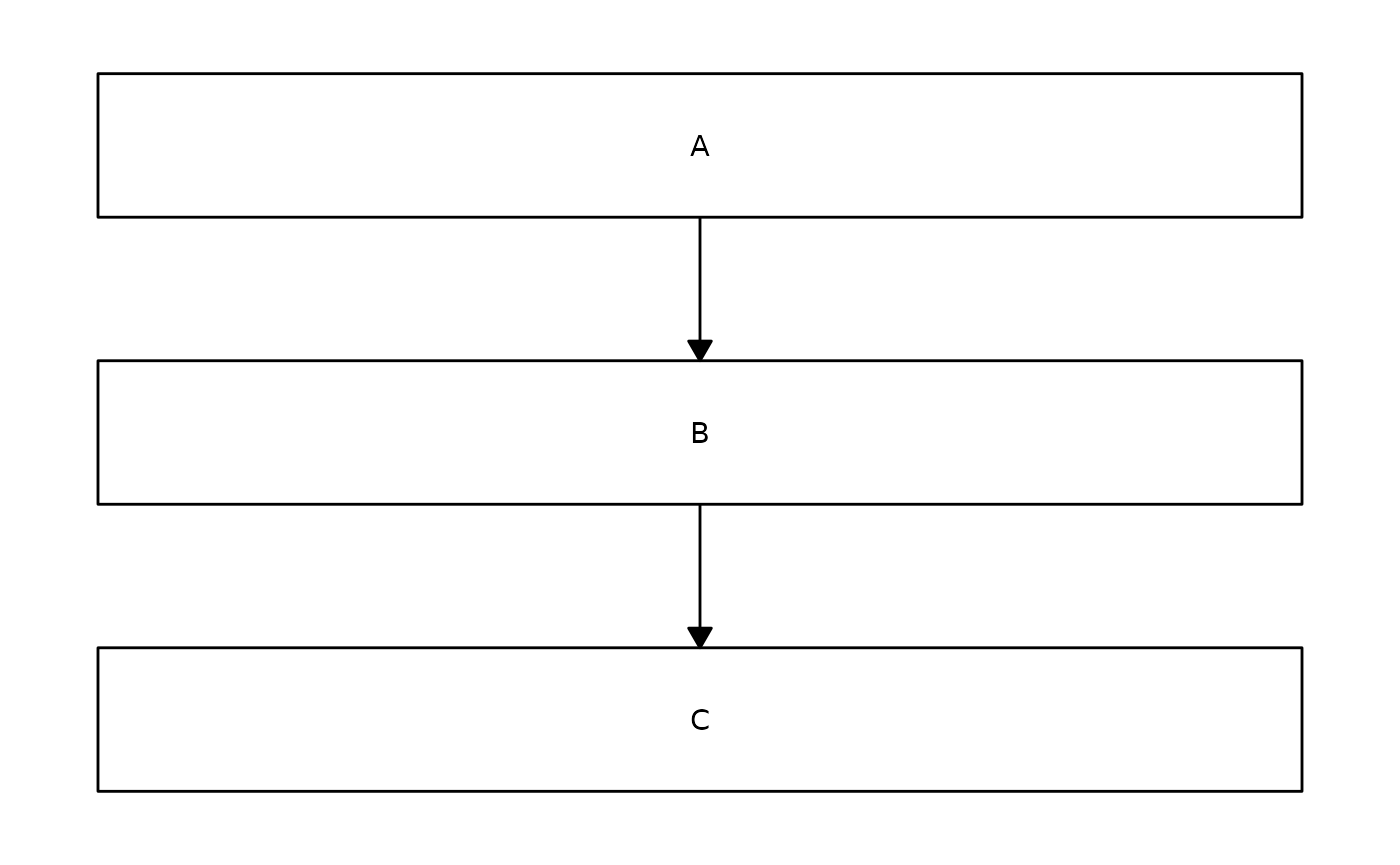
If you’d prefer a horizontal, left-to-right, flowchart simply set
horizontal = TRUE:
ggflowchart(data, layout = "tree", horizontal = TRUE)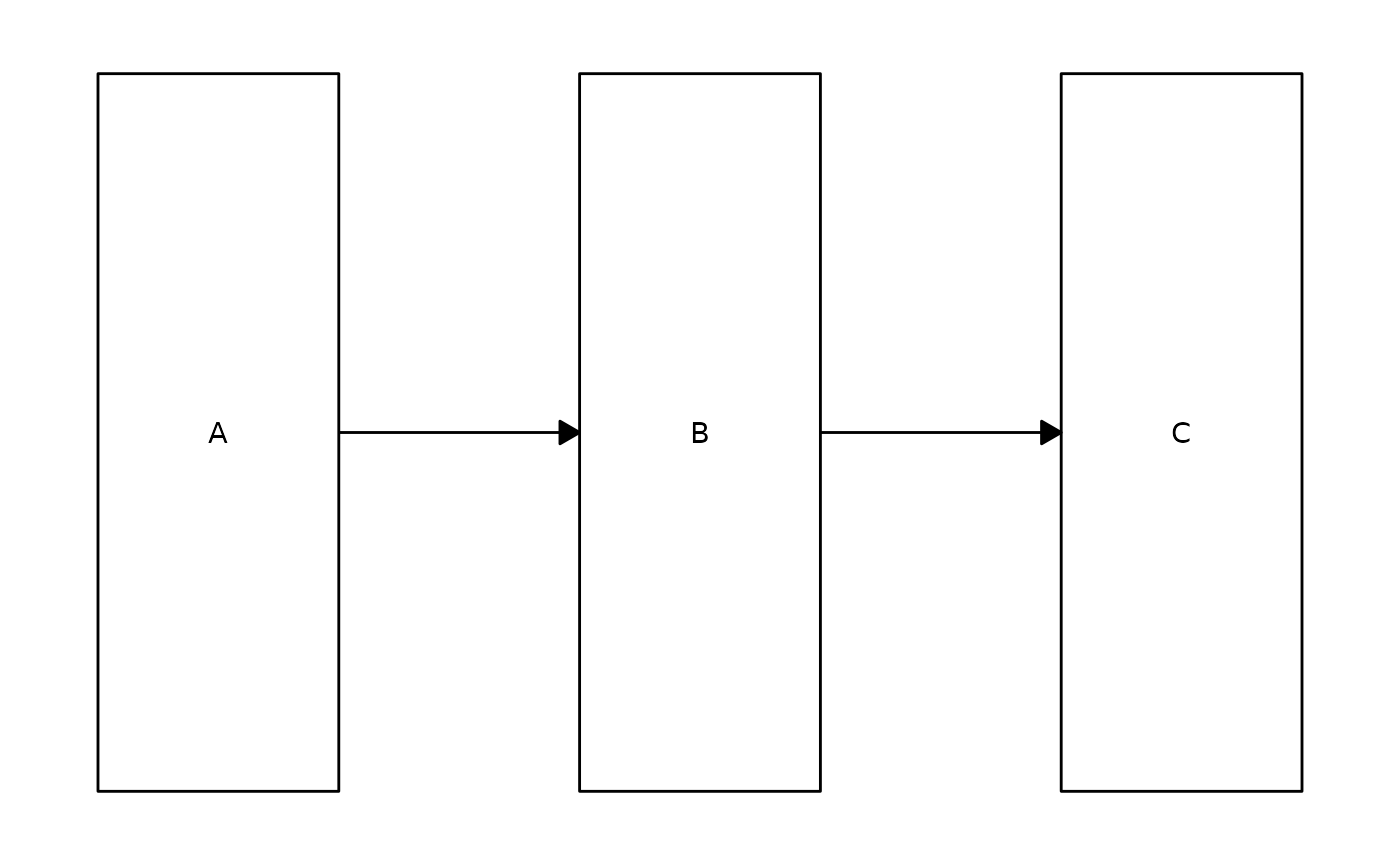
If you want more control over where the nodes are positioned, you can
specify layout = "custom". If you choose this option, you
must have a column named x and a column
named y in node_data (alongside
name) specifying the coordinates of the centre of each
node.
node_data <- tibble::tribble(
  ~name, ~x, ~y,
  "A", 1, 3,
  "B", 2, 2,
  "C", 3, 1
)
ggflowchart(data, node_data = node_data, layout = "custom")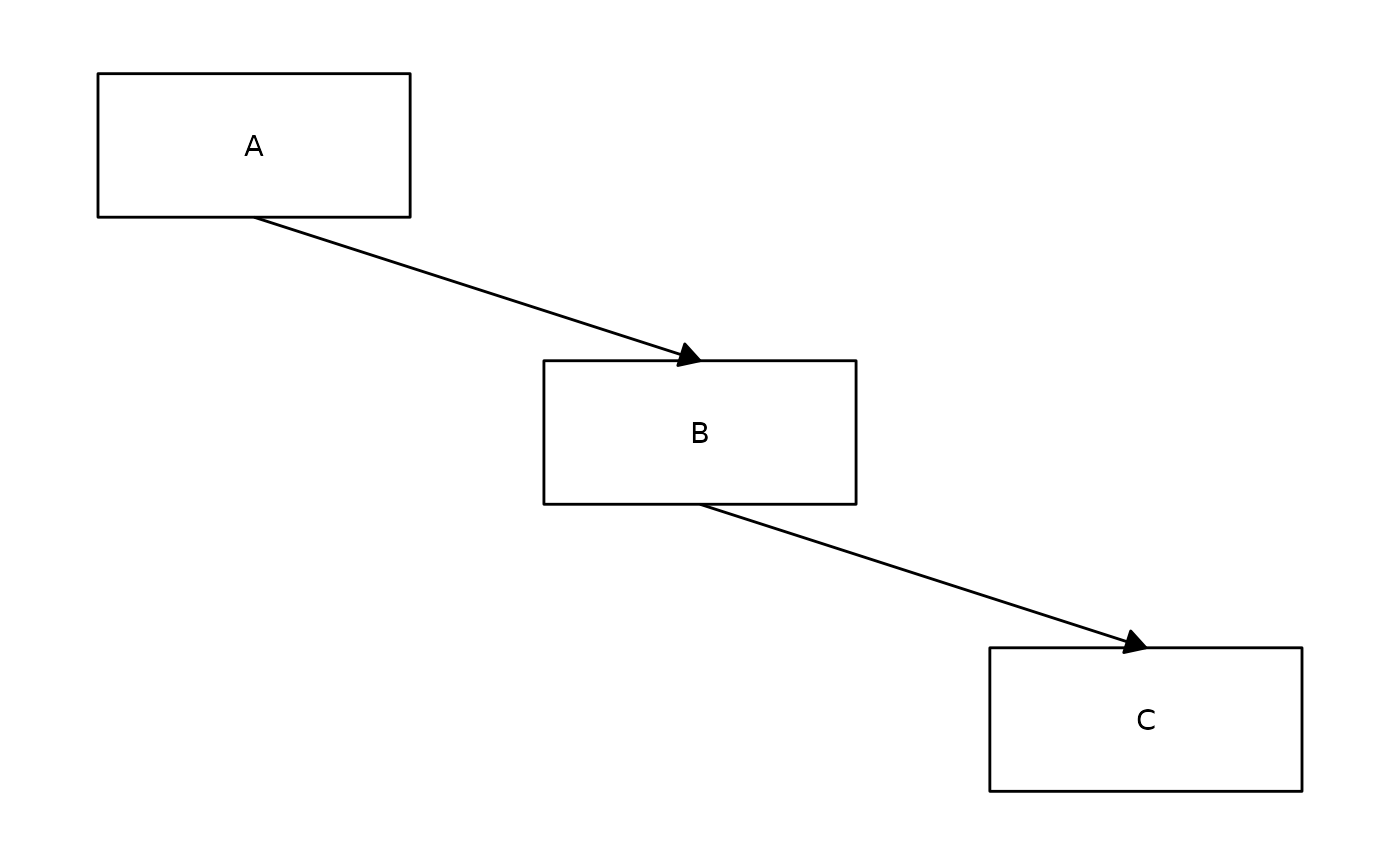
This means you can also create layouts using other functions or
packages. For example, you could create a custom layout using
igraph::layout_nicely() and pass it into
node_data:
library(dplyr)

# generate edges
data <- tibble::tribble(
  ~from, ~to,
  "A", "B",
  "A", "C",
  "A", "D"
)

# use a different layout from {igraph}
g <- igraph::graph_from_data_frame(
  select(data, c(from, to)),
  directed = TRUE
)
coords <- igraph::layout_as_star(g)
colnames(coords) <- c("x", "y")
node_data <- tibble::as_tibble(coords) %>%
  mutate(name = igraph::vertex_attr(g, "name"))

# create flowchart
ggflowchart(data, node_data = node_data, layout = "custom")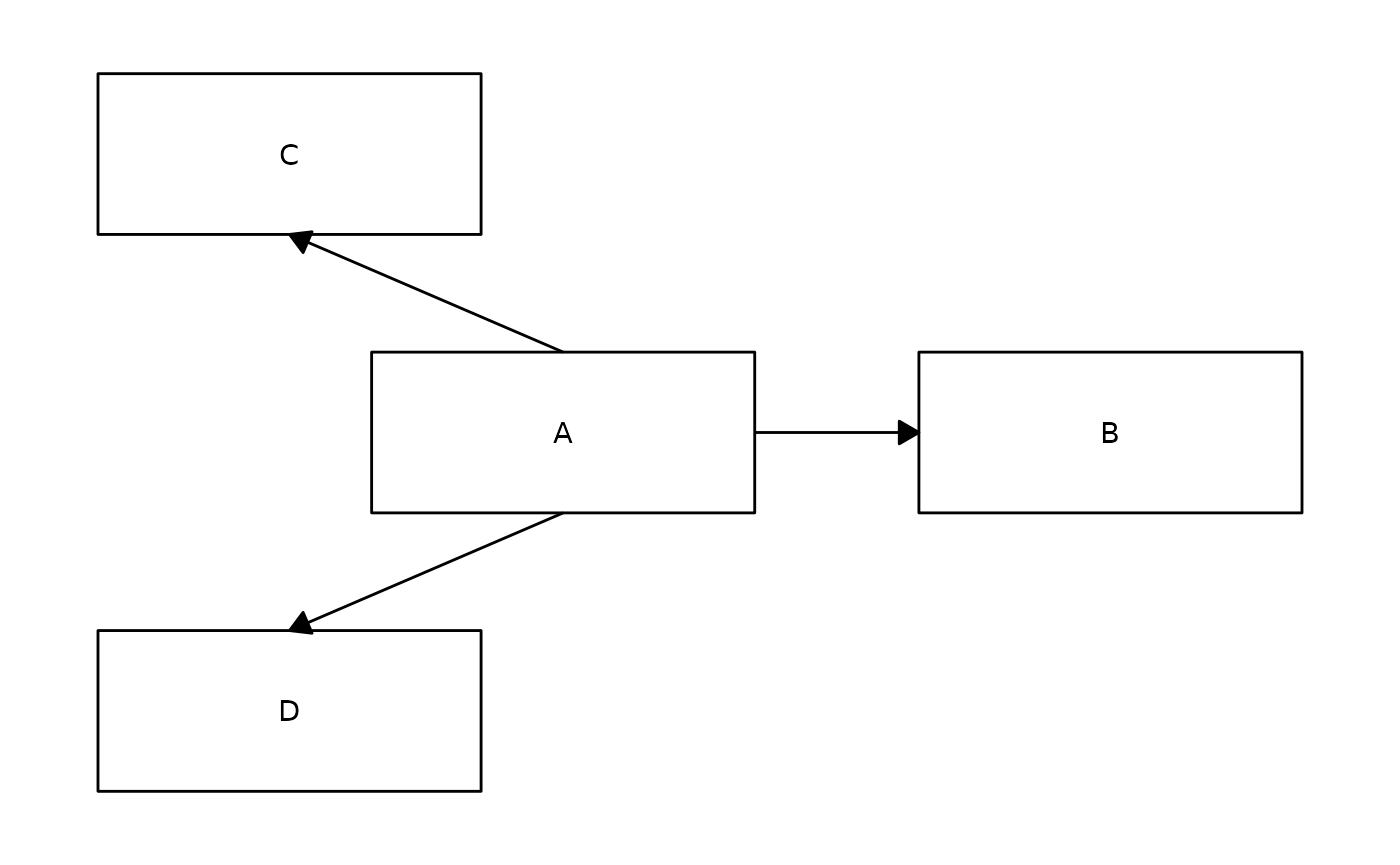
Some of these alternative layouts (especially ones from {igraph}), may eventually become additional layout options within {ggflowchart}. Note that the placement of the arrows may work better with some layout options than others.